投稿系统
投稿系统

SPSB4 as a risk factor for papillary thyroid cancer: Enhancing cell vitality under excess iodine exposure
doi: 10.1515/fzm-2025-0003
-
Abstract:
Objective The varying environmental exposure to iodine has long been a topic of interest, particularly given the noticeable increase in the incidence of papillary thyroid carcinoma (PTC) compared to other histopathological subtypes globally. This rise in thyroid cancer incidence has been attributed to several factors, including improved detection of early tumors, a higher prevalence of modifiable individual risk factors, and differing exposure to environmental risk factors such as iodine levels. This study aims to explore the epigenetic mechanisms that promote thyroid cancer progression under excess iodine exposure. Materials and methods This study outlines the following strategy: (i) risk factors were identified through statistical analysis of questionnaire responses in a retrospective iatrogenic study; (ii) following the identification of risk factors, RNA sequencing was performed using tissues from iodine-adequate (IA) and iodine-excess (IE) regions; (iii) candidate hub genes were selected via bioinformatics analysis; (iv) molecular biological techniques were employed to verify the functionality of the key gene. Results Through careful selection, we focused on SPSB4, a ubiquitin ligase previously unreported in relation to both iodine and thyroid cancer. By optimizing the dosage of PTC cell line activities, we determined how varying iodine levels can either enhance or impair the vitality of thyroid cancer cells. As anticipated, migration and invasion assays revealed significant changes when SPSB4 function was disrupted at the critical dose of KIO3. Conclusions In terms of epigenetic alterations, SPSB4 emerges as a promising candidate for further investigation, particularly in understanding thyroid cancer progression and potential carcinogenesis. Moreover, E3 ubiquitin ligases, including SPSB4, play a role in orchestrating adipose thermogenesis to maintain body temperature during cold stimuli. This study could also shed light on the influence of iodine on thermogenesis mediated by SPSB4 under cold conditions, while suggesting future exploration of SPSB4's effects on thyroid cancer in colder regions. -
Key words:
- thyroid cancer /
- water-borne iodine-excess exposure /
- retrospective iatrogenic /
- WGCNA /
- SPSB4
-

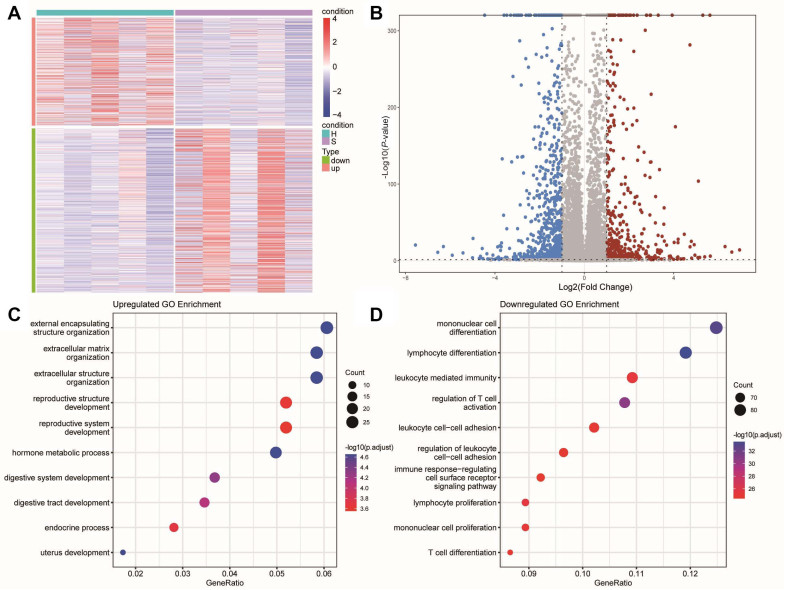
Figure 1. Heatmap and functional enrichment of differentially expressed genes (DEGs)
(A) Heatmap of 1310 differentially expressed genes (P-value < 0.05, |log2 FC| > 1) between patients with thyroid cancer in high iodine and normal iodine. (B) The volcano plot for DEGs. Gray dots represent genes which are not differentially expressed, red dots represent the upregulated genes, and the blue dots represent the downregulated genes. (C) Gene Ontology enrichment analysis was performed using upregulated genes. (D) Gene Ontology enrichment analysis was performed using downregulated genes.

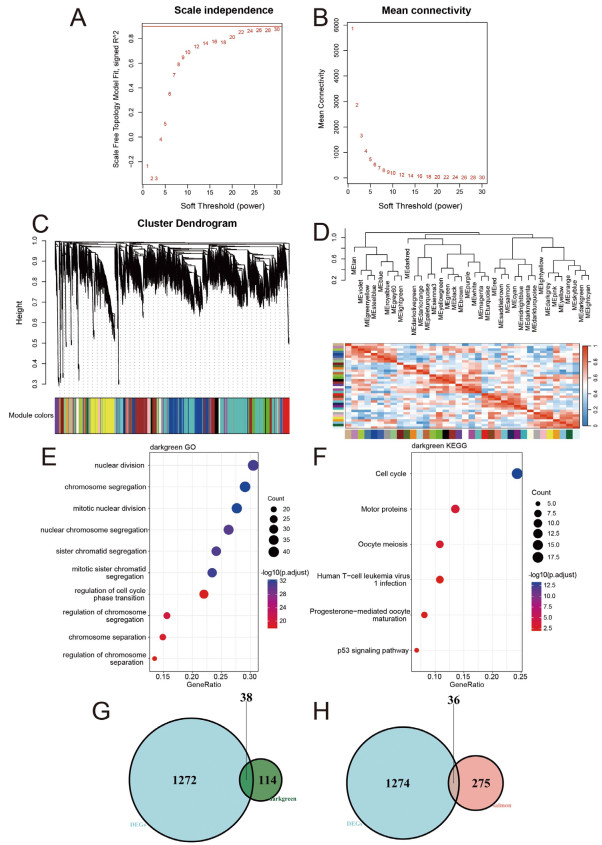
Figure 2. Weighted gene co-expression network analysis
(A) Network topology analysis for various weighting coefficients (soft-thresholding power, β). The x-axis represents different weighting coefficients. The y-axis represents the correlation coefficient between log (k) and log [P(k)]. The red line was 0.9. (B) Mean network connectivity under different weighting coefficients. (C) Gene co-expression modules were identified by using transcriptomic data of all genes by average hierarchical linkage clustering; the y-axis and x-axis represented the co-expression distance and genes respectively. Modules were identified using dynamic tree cutting by dividing the dendrogram at significant branch points. Modules were displayed with different colors below the dendrogram, and gray modules indicated unassigned genes. (D) The correlation coefficient between these different modules. Gene Ontology (E) and KEGG (F) pathways enrichment analysis for genes in the darkgreen module. (G, H) Venn diagram of DEGs in high iodine patients compared with normal iodine patients, and genes of darkgreen (G) and salmon module (H) in high iodine patients.

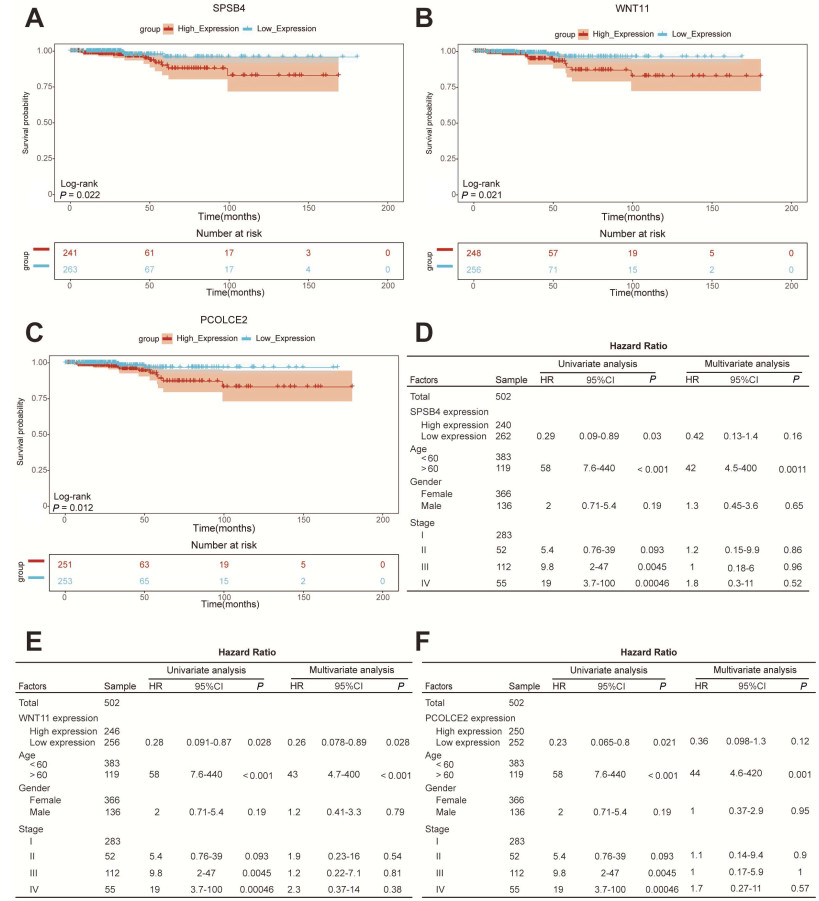
Figure 3. Identification of hub genes
A-C, Kaplan-Meier curve of SPSB4, WNT11 and PCOLCE2 gene expression with median cutoff values. D-F, Univariate and multivariate Cox regression analysis of different genes in patients with the Cancer Genome Atlas (TCGA) thyroid cancer. SPSB4 gene (D), WNT11 gene (E) and PCOLCE2 gene (F).

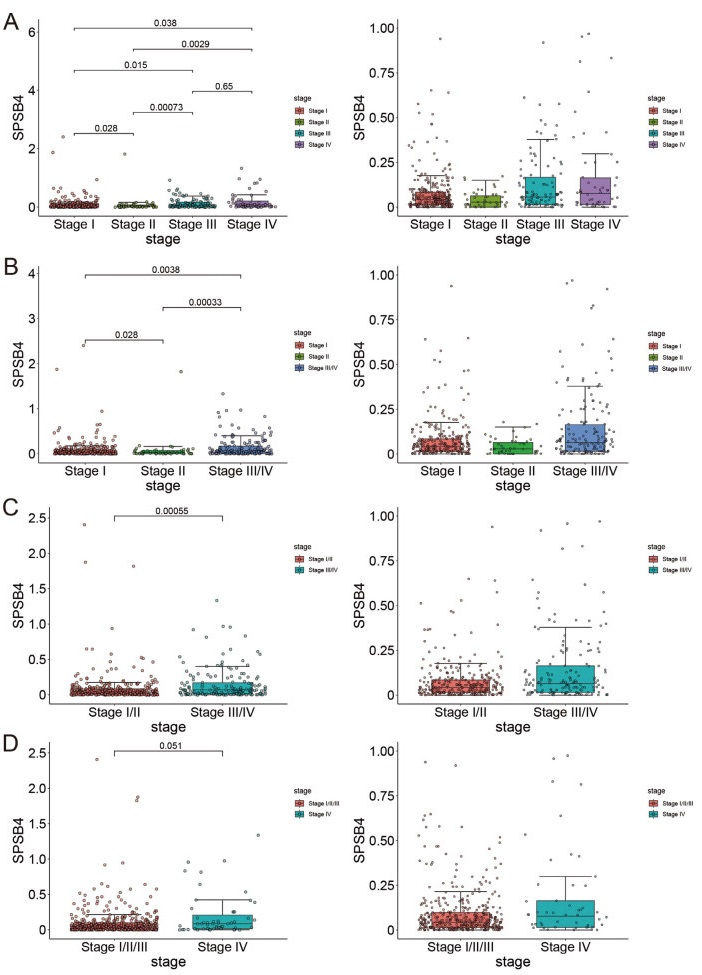
Figure 4. Comparison of SPSB4 expression among separated ways of clinical staging of thyroid cancer in the Cancer Genome Atlas (TCGA)
(A) independent; (B) stage III and IV merged; (C)stage I/II merged and III/IV merged; (D)stage I/II/III merged.

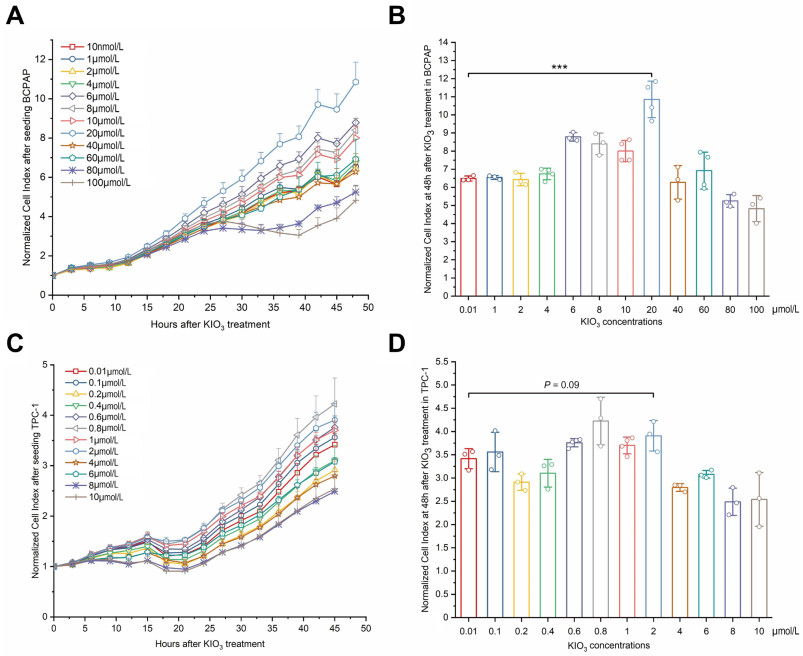
Figure 5. Confirmation of optimal KIO3 treating dose in papillary thyroid cancer (PTC) cell lines BCPAP and TPC-1
Cell suspensions were incubated in E-16 plate. KIO3 was compounded right when linear increase of cell index after a brief plateau phase. The timepoint is chosen as 24 h when observed from real-time cell index curve. The detecting interval is 15 minutes and whole period lasts for 96 hours. Cell index was normalized at the time when KIO3 was added. Cell index values were picked in an interval of 3 hours to draw showed curves. A, C, the cell viability of BCPAP (A) and TPC-1 (C) were measured by RTCA, error bars represent s.d. of measurement replicates (N ≥ 3). B, D, at 48h after KIO3 treated, NCIs of BCPAP (B) and TPC-1 (D) were compared with KIO3 concentrations from 0.01 µmol/L to 100 µmol/L and from 0.01 µmol/L to 10 µmol/L respectively. ***P < 0.001.

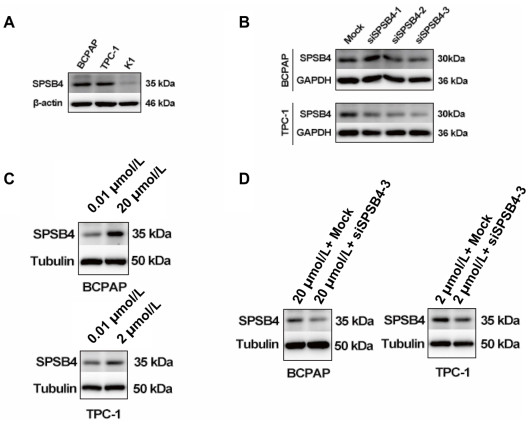
Figure 6. SPSB4 was upregulated in BCPAP and TPC-1 when treated with 20 µmol/L KIO3 or 2 µmol/L compared with 0.01 µmol/L, and knockdown of SPSB4 was performed with siSPSB4 transfection at 20 µmol/L KIO3 or 2 µmol/L KIO3. Cells were incubated in 12-well plates. KIO3 was compounded when cells grew to the density of 70%. Cell lysates were acquired at 48h after KIO3 treatment. 40 μg extractive was loaded for immunoblot. Primary antibody of SPSB4 was diluted with 1∶1000. (A) baselines of SPSB4 expressions in BCPAP, TPC-1 and K1 were immunoblotted. (B) transfected by three artificial siRNAs SPSB4 were immunoblotted in BCPAP and TPC-1 and one of construction, siSPSB4-3 was used for further study. (C) SPSB4 was detected after 20 µmol/L KIO3 or 2 µmol/L KIO3. (D) SPSB4 was exanimated for knockdown by siRNA at 20 µmol/L KIO3 or 2 µmol/L KIO3 in BCPAP and TPC-1, respectively.

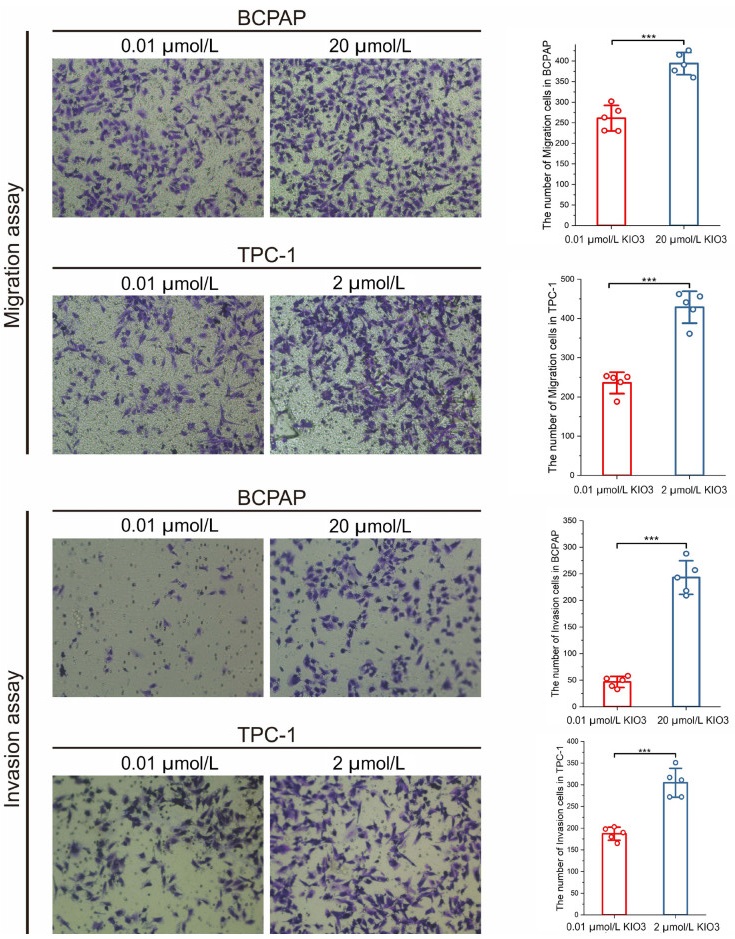
Figure 7. Migration and invasion assays of BCPAP and TPC-1 were conducted with 0.01, 2, 20 µmol/L KIO3 treatments
Cell numbers in every scene were counted by ImageJ. Firstly, pictures were transformed into 8-bit type, and inverted. Secondly, brightness and contrast were adjusted to perform a well visual. Finally, after watershed cell numbers were analyzed. Error bars represent s.d. of measurement replicates (N = 5). ***P < 0.001. Cells were stained after 12 h incubation.

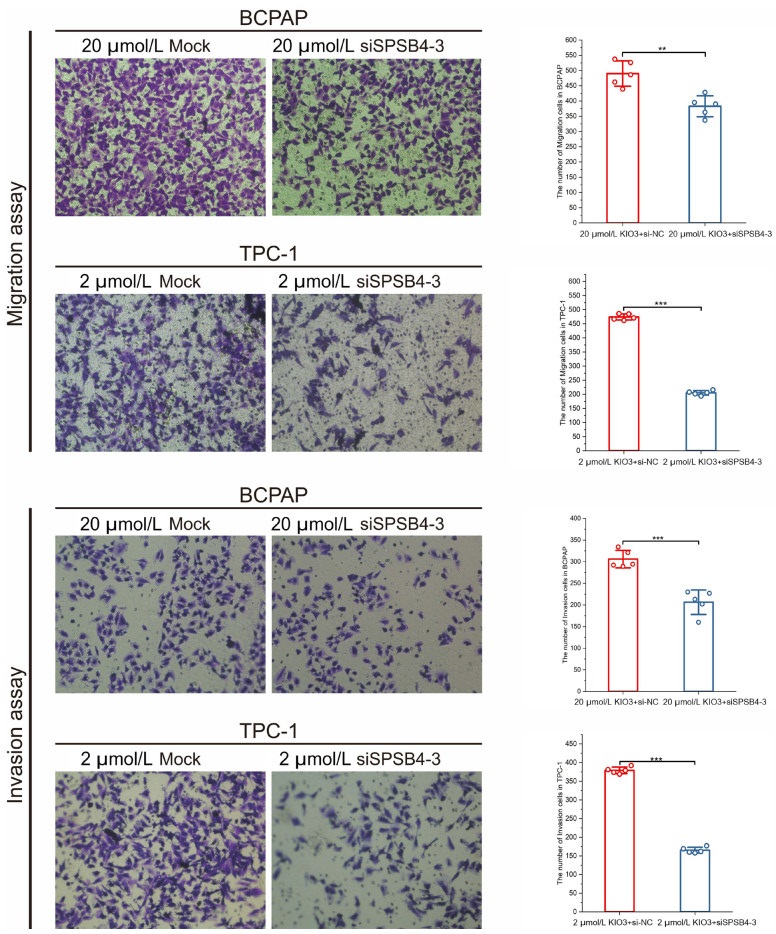
Figure 8. Migration and invasion assays of BCPAP and TPC-1 were conducted by transfecting siSPSB4-3
Cell numbers in every scene were counted by ImageJ. Firstly, pictures were transformed into 8-bit type, and inverted. Secondly, brightness and contrast were adjusted to perform a well visual. Finally, after watershed cell numbers were analyzed. Error bars represent s.d. of measurement replicates (N = 5). **P < 0.01, ***P < 0.001. Cells were stained after 24 h incubation.
Table 1. Clinicopathological characteristics of 273 papillary thyroid cancer patients
Variables Results Female gender 237 (86.81) Maximum size of tumor (cm) 0.91 ± 0.76 Multifocality 137 (50.18) Number of tumor foci 1.85 ± 1.10 Capsule extension 143 (52.38) Extrathyroidal extension 12 (4.4) Central lymph node metastasis 150 (54.95) Lateral lymph node metastasis 37 (13.55) Data are presented as n (%) or mean ± standard deviation.  下载: 导出CSV
Table 2. Chisq-test of Clinicopathological characteristics in 273 papillary thyroid cancer patients among different water iodine exposures
Variables 10-100μg/L (N = 104) > 100-300μg/L (N = 147) > 300μg/L (N = 22) P Gender 0.3901 Male 16(15.38%) 19(12.93%) 1(4.55%) Female 88(84.62%) 128(87.07%) 21(95.45%) Age 0.4853 < 60 92(88.46%) 135(91.84%) 21(95.45%) ≥ 60 12(11.54%) 12(8.16%) 1(4.55%) Size of maximum tumor (cm) 0.5059b da ≤ 1 79(75.96%) 109(74.15%) 17(77.27%) 1 < d ≤ 2 20(19.23%) 25(17.01%) 3(13.64%) 2 < d ≤ 4 5(4.81%) 12(8.16%) 1(4.55%) d > 4 0(0%) 1(0.68%) 1(4.55%) Number of total foci 0.8745 1 focus 52(50%) 71(48.3%) 13(59.09%) 2 foci 32(30.77%) 44(29.93%) 6(27.27%) ≥ 3 foci 20(19.23%) 32(21.77%) 3(13.64%) Laterality 0.1300 Unilateral 69(66.35%) 85(57.82%) 17(77.27%) Bilateral 35(33.65%) 62(42.18%) 5(22.73%) Capsule invasion 0.7349 Yes 52(50%) 79(53.74%) 13(59.09%) No 52(50%) 68(46.26%) 9(40.91%) Lymph node metastasis (harvestedc) 0.0183 Yes 67(64.42%) 94(63.95%) 10(45.45%) No 13(12.5%) 20(13.61%) 8(36.36%) T staging 0.2306 T1 98(94.23%) 129(87.76%) 20(90.91%) T2 3(2.88%) 10(6.8%) 0(0%) T3 1(0.96%) 6(4.08%) 2(9.09%) T4 2(1.92%) 2(1.36%) 0(0%) N staging 0.3976 N0 43(41.35%) 64(43.54%) 14(63.64%) N1a 48(46.15%) 62(42.18%) 6(27.27%) N1b 13(12.5%) 21(14.29%) 2(9.09%) Group comparisons of categorical variables were performed using the chi-square test. a, diameter of maximum tumor; b, for small cell values, Fisher's exact test was adopted; c, number of harvested lymph nodes is 212 extracted from total 273 patients.
下载: 导出CSV
Table 3. Clinicopathological features of harvested lymph nodes (LN) among different water iodine exposures
Variable (Harvested) 10-100μg/L (N = 80) > 100-300μg/L (N = 114) > 300μg/L (N = 18) P Average size of maximum tumor (cm) Mediana 0.70 0.80 0.60 0.05151 Averageb 0.89 1.10 0.93 0.22246 Central lymph node metastasis - Nc (positive%) 61 (81.33%) 81 (80.2%) 8 (50%) Positive LN mediand 3 3 5.5 Harvested LN mediane 6 7 9.5 Lateral lymph node metastasis - N (positive%) 14 (87.5%) 21 (95.45%) 2 (100%) Positive LN median 2 4 8 Harvested LN median 22 25 26.5 Data are presented as N (%), median or mean. a, medians of size of maximum tumor were compared using the Kruskal-Wallis test; b, means of size of maximum tumor were compared using the Student's t-test; c, N presents the number of lymph node metastasis in harvested lymph nodes; d, presents medians of number of lymph node metastasis in every patient under harvesting treatment; e, presents medians of number of harvested lymph nodes in every patient.
下载: 导出CSV
-
[1] Miranda-Filho A, Lortet-Tieulent J, Bray F, et al. Thyroid cancer incidence trends by histology in 25 countries: a population-based study. Lancet Diabetes Endocrinol, 2021; 9(4): 225-234. doi: 10.1016/S2213-8587(21)00027-9 [2] Pizzato M, Li M, Vignat J, et al. The epidemiological landscape of thyroid cancer worldwide: GLOBOCAN estimates for incidence and mortality rates in 2020. Lancet Diabetes Endocrinol, 2022; 10(4): 264-272. doi: 10.1016/S2213-8587(22)00035-3 [3] Kim J, Gosnell J E, Roman S A. Geographic influences in the global rise of thyroid cancer. Nat Rev Endocrinol, 2020; 16(1): 17-29. doi: 10.1038/s41574-019-0263-x [4] Zimmermann M B, Boelaert K. Iodine deficiency and thyroid disorders. Lancet Diabetes Endocrinol, 2015; 3(4): 286-295. doi: 10.1016/S2213-8587(14)70225-6 [5] Wang Y, Wang W. Increasing incidence of thyroid cancer in Shanghai, China, 1983-2007. Asia Pac J Public Health, 2015; 27(2): NP223-NP229. [6] Blomberg M, Feldt-Rasmussen U, Andersen K K, et al. Thyroid cancer in Denmark 1943-2008, before and after iodine supplementation. Int J Cancer, 2012; 131(10): 2360-2366. doi: 10.1002/ijc.27497 [7] Woodruff S L, Arowolo O A, Akute O O, et al. Global variation in the pattern of differentiated thyroid cancer. Am J Surg, 2010; 200(4): 462-466. doi: 10.1016/j.amjsurg.2010.03.009 [8] Guan H, Ji M, Bao R, et al. Association of high iodine intake with the T1799A BRAF mutation in papillary thyroid cancer. J Clin Endocrinol Metab, 2009; 94(5): 1612-1617. doi: 10.1210/jc.2008-2390 [9] Kim H J, Park H K, Byun D W, et al. Iodine intake as a risk factor for BRAF mutations in papillary thyroid cancer patients from an iodine-replete area. Eur J Nutr, 2018; 57(2): 809-815. doi: 10.1007/s00394-016-1370-2 [10] Xing M. Molecular pathogenesis and mechanisms of thyroid cancer. Nat Rev Cancer, 2013; 13(3): 184-199. doi: 10.1038/nrc3431 [11] Gerovska D, Garcia-Gallastegi P, Crende O, et al. GeromiRs are downregulated in the tumor microenvironment during colon cancer colonization of the liver in a murine metastasis model. Int J Mol Sci, 2021; 22(9): 4819. doi: 10.3390/ijms22094819 [12] Uhlen M, Zhang C, Lee S, et al. A pathology atlas of the human cancer transcriptome. Science, 2017; 357(6352): eaan2507. doi: 10.1126/science.aan2507 [13] Jeon Y G, Nahmgoong H, Oh J, et al. Ubiquitin ligase RNF20 coordinates sequential adipose thermogenesis with brown and beige fat-specific substrates. Nat Commun, 2024, 31; 15(1): 940. [14] Burgess J R, Dwyer T, McArdle K, et al. The changing incidence and spectrum of thyroid carcinoma in Tasmania (1978-1998) during a transition from iodine sufficiency to iodine deficiency. J Clin Endocrinol Metab, 2000; 85(4): 1513-1517. doi: 10.1210/jc.85.4.1513 [15] Burgess J R. Temporal trends for thyroid carcinoma in Australia: an increasing incidence of papillary thyroid carcinoma (1982-1997). Thyroid, 2002; 12(2): 141-149. doi: 10.1089/105072502753522374 [16] Wang Y, Wang W. Increasing incidence of thyroid cancer in Shanghai, China, 1983-2007. Asia Pac J Public Health, 2015; 27(2): 223-229. doi: 10.1177/1010539512436874 [17] Wiltshire J J, Drake T M, Uttley L, et al. Systematic review of trends in the incidence rates of thyroid cancer. Thyroid, 2016; 26(11): 1541-1552. doi: 10.1089/thy.2016.0100 [18] Kalk W J, Sitas F, Patterson A C. Thyroid cancer in South Africa—an indicator of regional iodine deficiency. S Afr Med J, 1997; 87(6): 735-738. [19] Lv C, Yang Y, Jiang L, et al. Association between chronic exposure to different water iodine and thyroid cancer: A retrospective study from 1995 to 2014. Sci Total Environ, 2017; 609: 735-741. doi: 10.1016/j.scitotenv.2017.07.101 [20] Nikiforov Y E, Nikiforova M N. Molecular genetics and diagnosis of thyroid cancer. Nat Rev Endocrinol, 2011; 7(10): 569-580. doi: 10.1038/nrendo.2011.142 [21] Wei P, Pan D, Mao C, et al. RNF34 is a cold-regulated E3 ubiquitin ligase for PGC-1α and modulates brown fat cell metabolism. Mol Cell Biol, 2012; 32(2): 266-275. doi: 10.1128/MCB.05674-11 [22] Song R, Peng W, Zhang Y, et al. Central role of E3 ubiquitin ligase MG53 in insulin resistance and metabolic disorders. Nature, 2013; 494(7437): 375-379. doi: 10.1038/nature11834 -
 fzm-5-1-22_ESM.docx

-

 点击查看大图
计量
- 文章访问数: 468
- HTML全文浏览量: 215
- PDF下载量: 17
- 被引次数: 0