投稿系统
投稿系统

Prognostic value of combined lymphocyte-to-monocyte ratio and cancer antigen 724 in patients with proximal gastric cancer residing in extremely cold regions
doi: 10.1515/fzm-2025-0020
-
Abstract:
Background This study aimed to evaluate the prognostic value of the lymphocyte-to-monocyte ratio (LMR) and cancer antigen 724 (CA724) in patients with proximal gastric cancer residing in cold climate regions. Methods A retrospective analysis was conducted on 313 patients diagnosed with proximal gastric cancer in cold climate regions between 2014 and 2017. Preoperative hematological markers, including LMR and CA724, were assessed. Receiver operating characteristic (ROC) curves were used to determine optimal cutoff values, which were then combined to form the LMR + CA724 score. Statistical analyses included Kaplan-Meier survival curves, log-rank tests, and Cox proportional hazards regression. Results A high preoperative LMR + CA724 score was significantly associated with older age, advanced pTNM stage, vascular invasion, and elevated levels of NMPVR, NMR, and AAR. The LMR + CA724 score demonstrated a higher area under the curve (AUC) compared to LMR or CA724 alone. Multivariate analysis identified pTNM stage, Borrmann type, histological type, and the LMR + CA724 score as independent prognostic factors for overall survival (OS). A nomogram incorporating these four variables achieved an AUC of 0.817, indicating strong predictive performance. Conclusion The LMR + CA724 score is a reliable and independent prognostic indicator for patients with proximal gastric cancer in cold climate regions. Its integration into clinical practice may support treatment planning and long-term management by enhancing personalized care. Further prospective studies are warranted to validate these findings in broader and more diverse patient populations. -

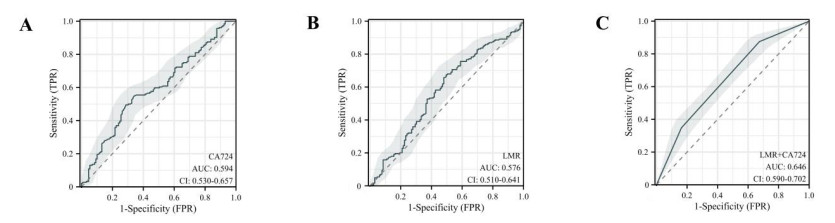
Figure 1. ROC curves of LMR, CA724, and LMR + CA724 score for predicting overall survival. ROC, Receiver operating characteristic; LMR, lymphocyte-to-monocyte ratio

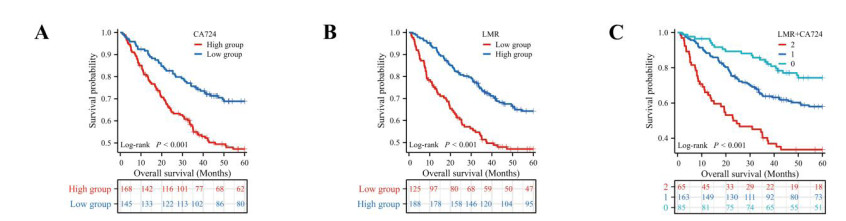
Figure 2. Kaplan-Meier survival curves based on LMR, CA724, and LMR + CA724 score. LMR, lymphocyte-to-monocyte ratio

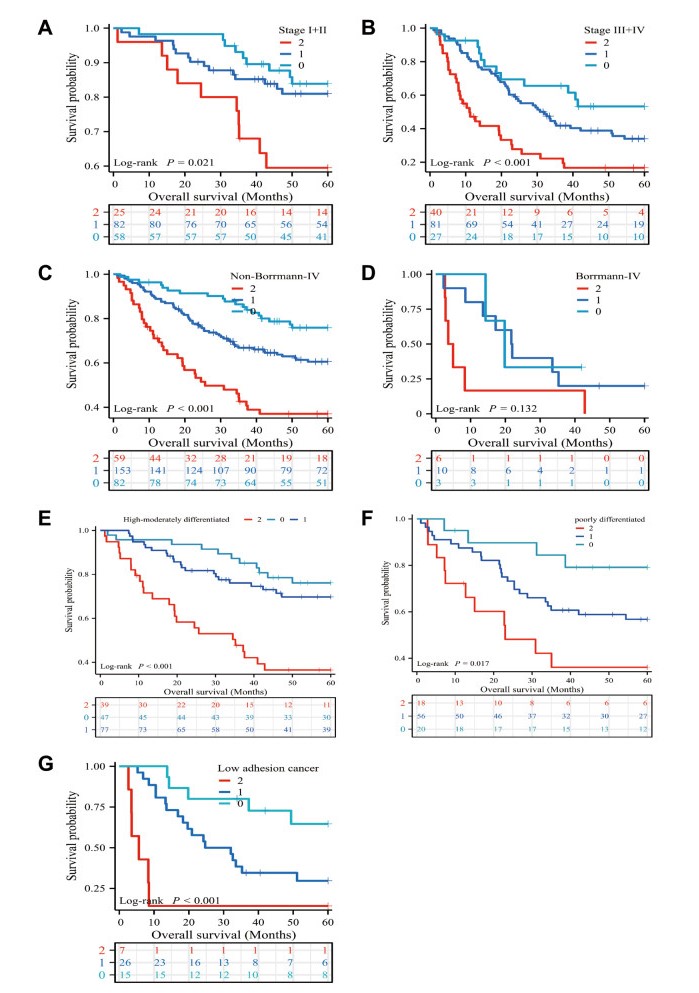
Figure 3. Subgroup analysis of combined scoring
(A) Stage Ⅰ-Ⅱ; (B) Stage Ⅲ-Ⅳ; (C) Non-Borrmann Ⅳ; (D) Borrmann Ⅳ; (E) High-moderately differentiated; (F) Poorly differentiated; (G) Low adhesion cancer.

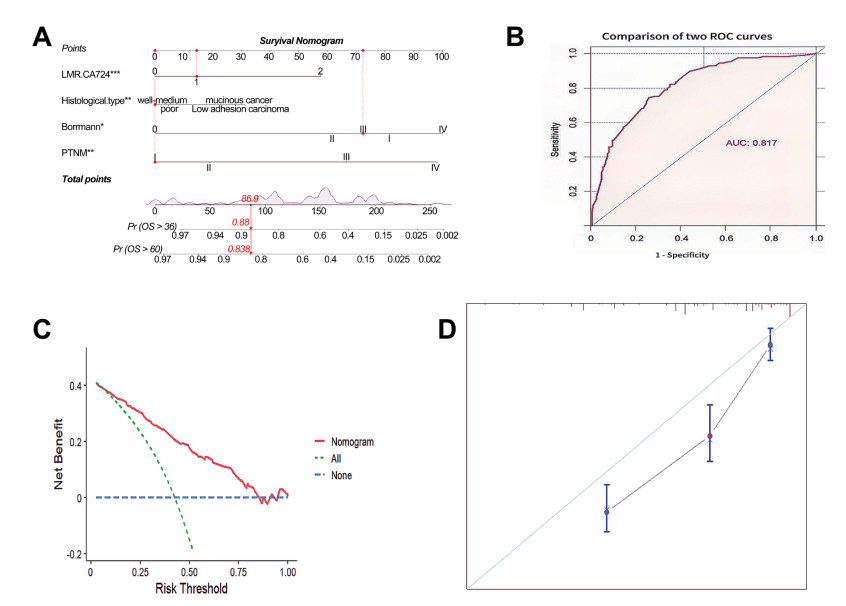
Figure 4. Prognostic nomogram for overall survival and corresponding calibration and decision curve analyses
(A) Nomogram predicting 5-year survival; (B) ROC analysis of nomogram predicting 5-year mortality rate; (C) Decision curve analysis of nomogram; (D) calibration curve of nomogram.
Table 1. Clinical and pathological characteristics of patients with proximal gastric cancer
Characteristics Overall (N = 313) Score0 (N = 85) Score1 (N = 163) Score2 (N = 65) P value Sex (%) Male 258 (82.4) 68 (80.0) 134 (82.2) 56 (86.2) 0.614 Female 55(17.6) 17 (20.0) 29(17.8) 9(13.8) Age (median [IQR]) 61.00 [53.00, 66.00] 60.00 [52.00, 65.00] 60.00 [52.00, 65.00] 64.00 [56.00, 70.00] 0.010 BMI (median [IQR]) 23.39 [21.45, 25.04] 24.06 [21.45, 25.95] 22.86 [21.37, 24.71] 23.29 [21.30, 24.61] 0.069 pTNM (%) Ⅰ 66(21.1) 28 (32.9) 29(17.8) 9(13.8) 0.006 Ⅱ 99(31.6) 30 (35.3) 53(32.5) 16 (24.6) Ⅲ 142 (45.4) 27 (31.8) 77(47.2) 38 (58.5) Ⅳ 6 (1.9) 0 (0.0) 4 (2.5) 2(3.1) Borrmann (%) 0 45(14.4) 17 (20.0) 23(14.1) 5(7.7) 0.267 Ⅰ 20(6.4) 6 (7.1) 10(6.1) 4(6.2) Ⅱ 53(16.9) 19 (22.4) 25(15.3) 9(13.8) Ⅲ 176 (56.2) 40 (47.1) 95(58.3) 41 (63.1) Ⅳ 19(6.1) 3 (3.5) 10(6.1) 6(9.2) Lauren (%) Intestinal 147 (47.0) 37 (43.5) 73(44.8) 37 (56.9) 0.351 Mixed 115 (36.7) 35 (41.2) 63(38.7) 17 (26.2) Diffuse 51(16.3) 13 (15.3) 27(16.6) 11 (16.9) LVI (%) Positive 158 (50.5) 52 (61.2) 82(50.3) 24 (36.9) 0.013 Negative 155 (49.5) 33 (38.8) 81(49.7) 41 (63.1) PNI (%) Positive 77(24.6) 27 (31.8) 37(22.7) 13 (20.0) 0.182 Negative 236 (75.4) 58 (68.2) 126 (77.3) 52 (80.0) Mesenchyme (%) Medullary 33(10.5) 7 (8.2) 17(10.4) 9(13.8) 0.528 Intermediate 245 (78.3) 71 (83.5) 124 (76.1) 50 (76.9) scirrhous 35(11.2) 7 (8.2) 22(13.5) 6(9.2) INF (%) INFa 108 (34.5) 25 (29.4) 60(36.8) 23 (35.4) 0.731 INFb 121 (38.7) 34 (40.0) 60(36.8) 27 (41.5) INFc 84(26.8) 26 (30.6) 43(26.4) 15 (23.1) HER2 (%) 0 157 (50.2) 47 (55.3) 83(50.9) 27 (41.5) 0.300 1 + 108 (34.5) 28 (32.9) 53(32.5) 27 (41.5) 2 + 30(9.6) 4 (4.7) 20(12.3) 6(9.2) 3 + 18(5.8) 6 (7.1) 7 (4.3) 5(7.7) chemotherapy (%) no 175 (55.9) 51 (60.0) 83(50.9) 41 (63.1) 0.167 yes 138 (44.1) 34 (40.0) 80(49.1) 24 (36.9) Histological.type (%) High-moderately 163 (52.1) 47 (55.3) 77(47.2) 39 (60.0) 0.444 poorly 94(30.0) 20 (23.5) 56(34.4) 18 (27.7) low adhesion 48(15.3) 15 (17.6) 26(16.0) 7(10.8) mucinous adenocarcino-ma 8 (2.6) 3 (3.5) 4 (2.5) 1(1.5) Tumor.size (median [IQR]) 50.00 [30.00, 60.00] 40.00 [25.00, 55.00] 45.00 [30.00, 60.00] 55.00 [40.00, 80.00] < 0.001 NMPVR (median [IQR]) 0.41 [0.32, 0.53] 0.38 [0.29, 0.46] 0.41 [0.33, 0.52] 0.47 [0.35, 0.61] 0.006 NMR (median [IQR]) 8.41 [6.90, 10.00] 8.88 [7.24, 10.07] 8.48 [7.04, 10.12] 7.65 [6.43, 8.80] 0.007 NLR (median [IQR]) 2.04 [1.54, 2.77] 1.70 [1.30, 2.25] 1.91 [1.53, 2.75] 2.91 [2.23, 3.54] < 0.001 MWR (median [IQR]) 0.07 [0.06, 0.08] 0.07 [0.06, 0.07] 0.07 [0.06, 0.08] 0.09 [0.08, 0.09] < 0.001 HALP (median [IQR]) 42.28 [25.37, 60.08] 47.60 [35.09, 66.91] 45.33 [28.52, 60.65] 26.07 [19.94, 42.14] < 0.001 HPR (median [IQR]) 0.57 [0.41, 0.71] 0.59 [0.44, 0.69] 0.58 [0.41, 0.72] 0.51 [0.33, 0.65] 0.063 RPR (median [IQR]) 0.06 [0.05, 0.07] 0.06 [0.05, 0.07] 0.06 [0.05, 0.07] 0.06 [0.05, 0.07] 0.723 PLR (median [IQR]) 125.62 [98.11, 170.11] 115.82 [89.22, 137.16] 123.40 [97.44, 163.60] 173.83 [132.54, 212.29] < 0.001 AAR (median [IQR]) 1.12 [0.88, 1.33] 1.13 [0.88, 1.33] 1.03 [0.87, 1.27] 1.21 [1.06, 1.55] 0.012 LAR (median [IQR]) 3.79 [3.45, 4.36] 3.77 [3.40, 4.38] 3.76 [3.48, 4.26] 3.89 [3.46, 4.53] 0.629 LLR (median [IQR]) 83.54 [65.47, 105.11] 73.86 [60.93, 89.63] 83.24 [64.21, 104.44] 99.38 [80.72, 125.62] < 0.001 TBAR (median [IQR]) 0.26 [0.21, 0.36] 0.26 [0.20, 0.35] 0.27 [0.21, 0.36] 0.26 [0.21, 0.37] 0.775 DIR (median [IQR]) 0.57 [0.46, 0.68] 0.57 [0.46, 0.66] 0.56 [0.45, 0.69] 0.60 [0.49, 0.71] 0.207 GLR (median [IQR]) 2.83 [2.24, 3.56] 2.52 [2.03, 3.03] 2.76 [2.16, 3.57] 3.39 [2.62, 4.27] < 0.001 FAR (median [IQR]) 0.08 [0.06, 0.09] 0.07 [0.06, 0.08] 0.07 [0.06, 0.09] 0.09 [0.07, 0.10] < 0.001 FLR (median [IQR]) 1.66 [1.23, 2.15] 1.38 [1.05, 1.77] 1.54 [1.23, 2.07] 2.15 [1.82, 2.72] < 0.001 IQR, Interquartile range; NMPVR, Neutrophil count/Mean Platelet Volume; LMR, Lymphocyte count/Monocyte count; NMR, Neutrophil count/Monocyte count; NLR, Neutrophil count/Lymphocyte count; HALP, (Hemoglobin × Albumin × Lymphocyte count)/Platelet count; HPR, Hemoglobin/Platelet count; RPR, RDW/Platelet count; PLR, Platelet count/Lymphocyte count; AAR, AST/ALT; LAR, LDH/Albumin; LLR, LDH/Lymphocyte count; TBAR, Total Bilirubin/Albumin; DIR, Direct Bilirubin/Indirect Bilirubin; GLR, Glucose/Lymphocyte count; FLR, Fibrinogen/Lymphocyte count.  下载: 导出CSV
Table 2. Univariate Cox analysis of hematological markers associated with overall survival
Characteristics Univariate analysis Multivariate analysis Characteristics Univariate analysis Multivariate analysis OR (95% CI) P value OR (95% CI) P value OR (95% CI) P value OR (95% CI) P value Sex Mesenchyme Male Reference (reference) medullary type Reference Reference Female 1.18(0.76-1.83) 0.457 NA NA intermedius type 0.76(0.46-1.28) 0.304 NA NA Age 1.02(1-1.04) 0.063 NA NA hard type 0.94(0.47-1.85) 0.852 NA NA BMI 0.96(0.91-1.02) 0.196 NA NA INF pTNM INFa Reference Reference Ⅰ Reference Reference INFb 0.73(0.47-1.14) 0.169 0.71(0.43-1.17) 0.1781 Ⅱ 3.51(1.45-8.48) 0.005 1.45(0.5-4.24) 0.4937 INFc 1.86(1.23-2.79) 0.003 1.08(0.65-1.79) 0.7679 Ⅲ 11.94 (5.21-27.35) 0 4.18(1.42-12.32) 0.0095 HER-2 Ⅳ 24.63 (7.47-81.23) 0 8.53(1.99-36.56) 0.0039 0 Reference Reference Lauren classification 1 + 0.91(0.62-1.33) 0.617 NA NA Intestinal Reference Reference 2 + 0.82(0.43-1.55) 0.540 NA NA Mixed 0.93(0.62-1.38) 0.711 0.96(0.56-1.66) 0.8861 3 + 1.28(0.66-2.49) 0.463 NA NA Diffuse 1.59(1.01-2.49) 0.045 1.42(0.82-2.44) 0.2069 Chemotherapy Borrmann type No Reference Reference Borrmann0 Reference Reference Yes 0.98(0.69-1.39) 0.905 NA NA Borrmann Ⅰ 11.62 (2.47-54.75) 0.002 5.27(0.9-30.72) 0.0649 Histology Borrmann Ⅱ 9.12(2.12-39.33) 0.003 3.39(0.6-19.33) 0.1685 High-moderately Reference Reference Borrmann Ⅲ 15.47 (3.8-62.9) 0 4.36(0.78-24.23) 0.0927 poorly 1.27(0.84-1.91) 0.252 1.12(0.7-1.78) 0.6378 Borrmann Ⅳ 43.52 (9.97-189.87) 0 6.9 (1.13-42.12) 0.0365 low adhesion 2.18(1.39-3.41) 0.001 1.98(1.09-3.58) 0.0241 Lymphovascular invasion (LVI) mucinous adenocarcinoma 1.73(0.63-4.76) 0.291 1.69(0.57-5.02) 0.3418 no Reference Reference LMR + CA724 yes 1.79(1.26-2.54) 0.001 0.74(0.48-1.14) 0.1778 0 Reference Reference PNI 1 1.89(1.16-3.1) 0.011 1.42(0.85-2.37) 0.1753 no Reference Reference 2 4.19(2.48-7.09) < 0.001 3.81(2.17-6.69) < 0.001 yes 2.17(1.35-3.5) 0.001 1.17(0.68-2.04) 0.5715 Tumor.size (median [IQR]) 1.02 (1.01-1.03) < 0.001 1 (0.99-1.01) 0.5693 BMI, body mass index; PNI, perineural invasion; INF, infiltrative pattern; HER-2, human epidermal growth factor receptor 2; LMR, lymphocyte-to-monocyte ratio; NA, Not available.
下载: 导出CSV
-
[1] Erratum: Global cancer statistics 2018: GLOBOCAN estimates of incidence and mortality worldwide for 36 cancers in 185 countries. CA Cancer J Clin, 2020; 70(4): 313. [2] Soerjomataram I, Lortet-Tieulent J, Parkin D M, et al. Global burden of cancer in 2008: a systematic analysis of disability-adjusted life-years in 12 world regions. Lancet, 2012; 380(9856): 1840-1850. doi: 10.1016/S0140-6736(12)60919-2 [3] Botterweck A A, Schouten L J, Volovics A, et al. Trends in incidence of adenocarcinoma of the oesophagus and gastric cardia in ten European countries. Int J Epidemiol, 2000; 29(4): 645-654. doi: 10.1093/ije/29.4.645 [4] Huang Q, Shi J, Sun Q, et al. Clinicopathological characterisation of small (2 cm or less) proximal and distal gastric carcinomas in a Chinese population. Pathology, 2015; 47(6): 526-532. doi: 10.1097/PAT.0000000000000276 [5] Parfitt J R, Miladinovic Z, Driman D K. Increasing incidence of adenocarcinoma of the gastroesophageal junction and distal stomach in Canada -- an epidemiological study from 1964-2002. Can J Gastroenterol, 2006; 20(4): 271-276. doi: 10.1155/2006/175751 [6] Wang X, Liu F, Li Y, et al. Comparison on clinicopathological features, treatments and prognosis between proximal gastric cancer and distal gastric cancer: a national cancer data base analysis. J Cancer, 2019; 10(14): 3145-3153. doi: 10.7150/jca.30371 [7] Röcken C, Behrens H M. Validating the prognostic and discriminating value of the TNM-classification for gastric cancer - a critical appraisal. Eur J Cancer, 2015; 51(5): 577-586. doi: 10.1016/j.ejca.2015.01.055 [8] Pan Y C, Jia Z F, Cao D H, et al. Preoperative lymphocyte-tomonocyte ratio (LMR) could independently predict overall survival of resectable gastric cancer patients. Medicine (Baltimore), 2018; 97(52): e13896. doi: 10.1097/MD.0000000000013896 [9] Duzkopru Y, Kocanoglu A, Dogan O, et al. Hemoglobin, albumin, lymphocyte, and platelet score as a predictor of prognosis in metastatic gastric cancer. World J Gastrointest Oncol, 2023; 15(9): 1626-1635. doi: 10.4251/wjgo.v15.i9.1626 [10] Hannarici Z, Yılmaz A, Buyukbayram M E, et al. The value of pretreatment glucose-to-lymphocyte ratio for predicting survival of metastatic gastric cancer. Future Oncol, 2023; 19(4): 315-325. doi: 10.2217/fon-2022-0579 [11] Chandra R, Balachandar N, Wang S, et al. The changing face of gastric cancer: epidemiologic trends and advances in novel therapies. Cancer Gene Ther, 2021; 28(5): 390-399. doi: 10.1038/s41417-020-00234-z [12] Penta R, De Falco M, Iaquinto G, et al. Helicobacter pylori and gastric epithelial cells: from gastritis to cancer. J Exp Clin Cancer Res, 2005; 24(3): 337-345. [13] Sun B, Karin M. Obesity, inflammation, and liver cancer. J Hepatol, 2012; 56(3): 704-713. doi: 10.1016/j.jhep.2011.09.020 [14] Ye Z, Yu P, Cao Y, et al. Prediction of peritoneal cancer index and prognosis in peritoneal metastasis of gastric cancer using NLR-PLR-DDI score: a retrospective study. Cancer Manag Res, 2022; 14: 177-187. doi: 10.2147/CMAR.S343467 [15] Shi X, Li S, Wang Y, et al. Predictive value of platelet-to-lymphocyte ratio combined with CA199 levels in postoperative survival of patients with gastric cancer: A retrospective study. Int Immunopharmacol, 2023; 124(Pt B): 110987. doi: 10.1016/j.intimp.2023.110987 [16] Gong X, Zhang H. Diagnostic and prognostic values of antihelicobacter pylori antibody combined with serum CA724, CA19-9, and CEA for young patients with early gastric cancer. J Clin Lab Anal, 2020; 34(7): e23268. doi: 10.1002/jcla.23268 [17] Kang M, Jeong C W, Kwak C, et al. Preoperative neutrophillymphocyte ratio can significantly predict mortality outcomes in patients with non-muscle invasive bladder cancer undergoing transurethral resection of bladder tumor. Oncotarget, 2017; 8(8): 12891-12901. doi: 10.18632/oncotarget.14179 [18] Fridman W H, Pagès F, Sautès-Fridman C, et al. The immune contexture in human tumours: impact on clinical outcome. Nat Rev Cancer, 2012; 12(4): 298-306. doi: 10.1038/nrc3245 [19] Salazar-Onfray F, López M N, Mendoza-Naranjo A. Paradoxical effects of cytokines in tumor immune surveillance and tumor immune escape. Cytokine Growth Factor Rev, 2007; 18(1-2): 171-182. doi: 10.1016/j.cytogfr.2007.01.015 [20] Wilcox R A, Wada D A, Ziesmer S C, et al. Monocytes promote tumor cell survival in T-cell lymphoproliferative disorders and are impaired in their ability to differentiate into mature dendritic cells. Blood, 2009; 114(14): 2936-2944. doi: 10.1182/blood-2009-05-220111 [21] Peng L S, Zhang J Y, Teng Y S, et al. Tumor-associated monocytes/macrophages impair NK-Cell function via TGFβ1 in human gastric cancer. Cancer Immunol Res, 2017; 5(3): 248-256. doi: 10.1158/2326-6066.CIR-16-0152 [22] Mantovani A, Schioppa T, Porta C, et al. Role of tumor-associated macrophages in tumor progression and invasion. Cancer Metastasis Rev, 2006; 25(3): 315-322. doi: 10.1007/s10555-006-9001-7 [23] Mantovani A, Allavena P, Sica A, et al. Cancer-related inflammation. Nature, 2008; 454(7203): 436-444. doi: 10.1038/nature07205 [24] Toyokawa T, Kubo N, Tamura T, et al. The pretreatment Controlling Nutritional Status (CONUT) score is an independent prognostic factor in patients with resectable thoracic esophageal squamous cell carcinoma: results from a retrospective study. BMC Cancer, 2016; 16(1): 722. doi: 10.1186/s12885-016-2696-0 [25] Chan J C, Chan D L, Diakos C I, et al. The lymphocyte-tomonocyte ratio is a superior predictor of overall survival in comparison to established biomarkers of resectable colorectal cancer. Ann Surg, 2017; 265(3): 539-546. doi: 10.1097/SLA.0000000000001743 [26] Chen X Z, Zhang W K, Yang K, et al. Correlation between serum CA724 and gastric cancer: multiple analyses based on Chinese population. Mol Biol Rep, 2012; 39(9): 9031-9039. doi: 10.1007/s11033-012-1774-x [27] Liang Y, He M, Fan X, et al. An abnormal elevation of serum CA72-4 by ganoderma lucidum spore powder. Ann Clin Lab Sci, 2013; 43(3): 337-340. -

 点击查看大图
计量
- 文章访问数: 276
- HTML全文浏览量: 163
- PDF下载量: 4
- 被引次数: 0